Component User Metrics
The Component User Metrics system in Kinesis API provides detailed analytics about user interactions with your content. This powerful feature tracks and visualizes visitor behavior for blog posts, snippets, and redirects, giving you insights into how your content is being accessed and by whom.
Overview
Component User Metrics automatically capture detailed information about each visitor who accesses your content, including:
- Device Information: Browser, operating system, and device type
- Geographic Data: Location details including continent, country, region, and city
- Technical Details: Rendering engine, architecture, and version information
- Access Patterns: When and how often content is accessed
This data is collected transparently and stored securely, allowing you to understand your audience better and make data-driven decisions about your content strategy.
Understanding Metrics Data
Each metric entry captures comprehensive information about a single visit:
User Agent Information
- Product: The browser or client application (e.g., Firefox, Chrome, Safari)
- Product Version: Specific version of the browser
- Engine: Rendering engine used (e.g., Gecko, Blink, WebKit)
- Engine Version: Version of the rendering engine
- Architecture: CPU architecture (e.g., x86_64, ARM)
Device Information
- Device Type: Classification of the device (Desktop, Mobile, Tablet)
- Brand: Manufacturer of the device (e.g., Apple, Samsung, Google)
- Model: Specific device model
Operating System
- OS Name: Operating system (e.g., macOS, Windows, Linux, Android, iOS)
- OS Version: Specific version of the operating system
Geographic Information
- Continent: Continental region of the visitor
- Country: Country of origin
- Subdivisions: State, province, or region within the country
- City: City or locality
- IP Address: Visitor’s IP address (stored for reference)
Temporal Information
- Timestamp: Exact date and time of the access in RFC3339 format
Accessing Metrics
Metrics are available for three types of content:
Blog Post Metrics
To view metrics for a blog post:
- Navigate to the blog post edit page (
/web/blog/edit?id=POST_ID) - Click the “View Metrics” button below the form
- The metrics dashboard will display all visitor data for that post
Alternatively, from the blog posts list page:
- Navigate to
/web/blog - Click the dashboard icon (chart icon) next to the blog post you want to analyze
- The metrics dashboard will display all visitor data for that post
Snippet Metrics
To view metrics for a snippet:
- Navigate to the snippet view page (
/web/snippets/view?id=SNIPPET_LOCATOR) - Click the “View metrics” button in the snippet controls
- The metrics dashboard will display all visitor data for that snippet
Alternatively, from the snippet edit page:
- Navigate to
/web/snippets/edit?id=SNIPPET_LOCATOR - Click the “View Metrics” button below the form
- The metrics dashboard will display all visitor data for that snippet
You can also access metrics from the snippets list page:
- Navigate to
/web/snippets - Click the dashboard icon (chart icon) next to the snippet you want to analyze
- The metrics dashboard will display all visitor data for that snippet
Redirect Metrics
To view metrics for a redirect:
- Navigate to the redirects management page (
/web/redirects) - Click the dashboard icon (chart icon) next to the redirect you want to analyze
- The metrics dashboard will display all visitor data for that redirect
Metrics Dashboard
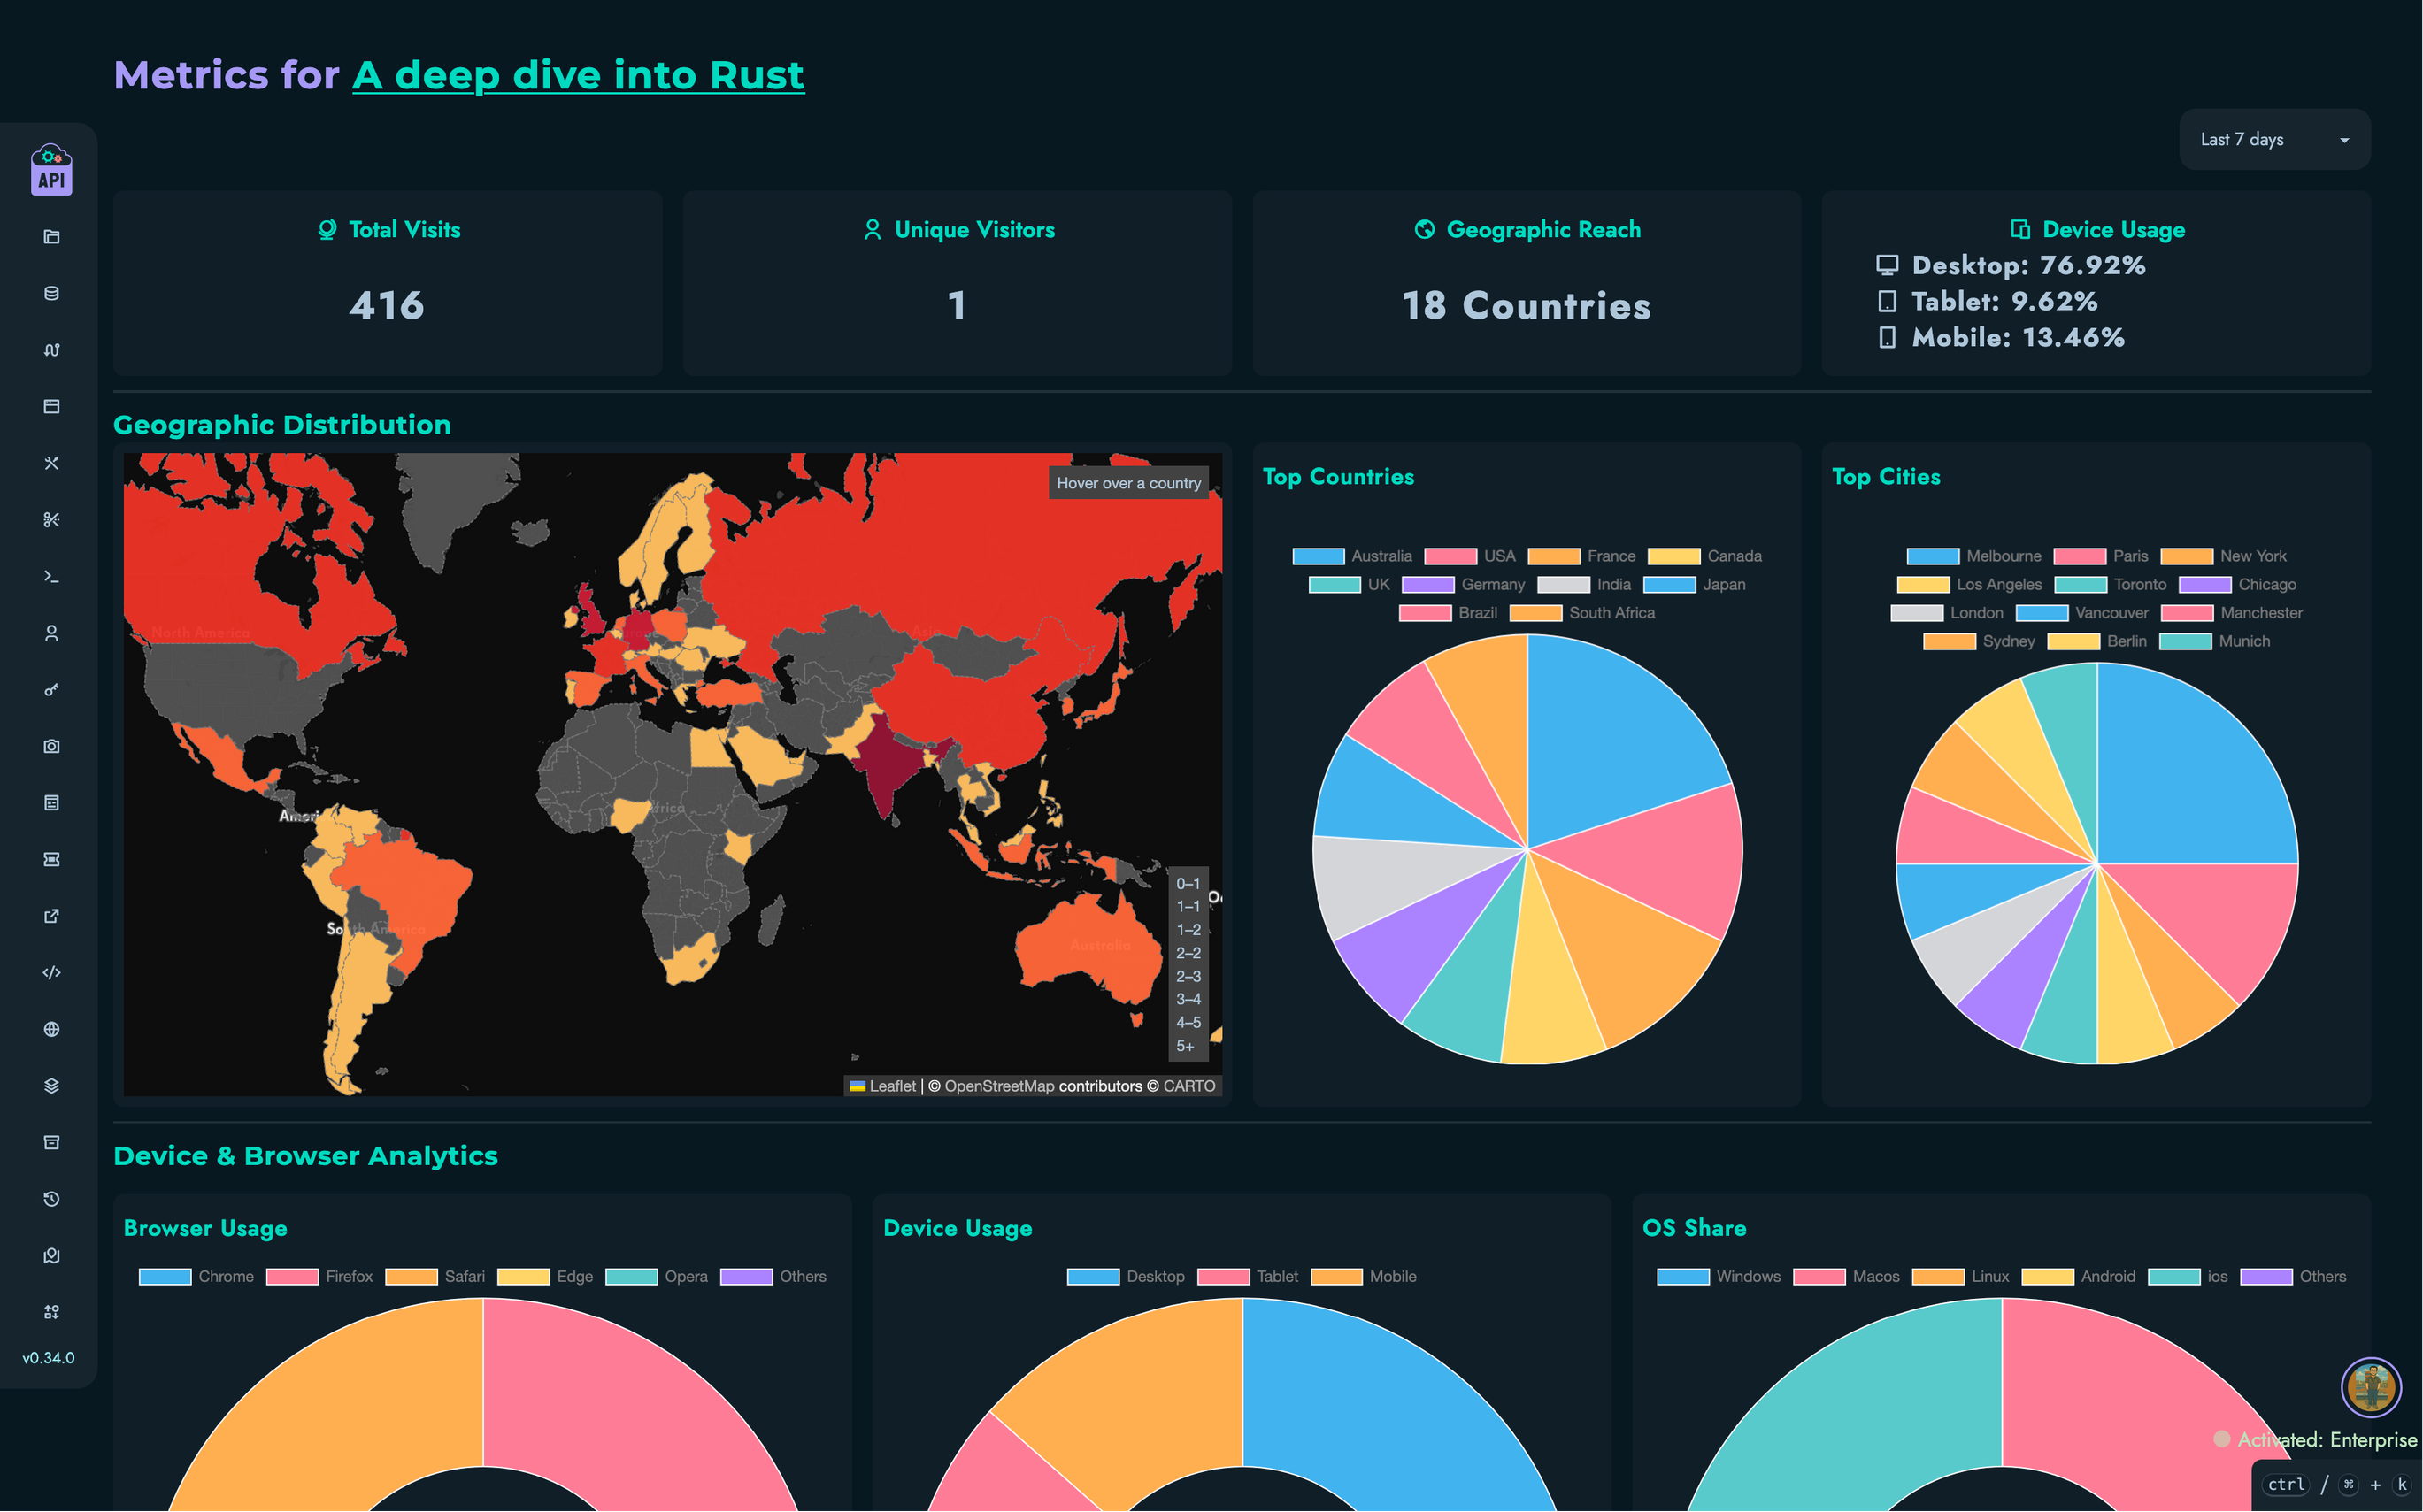
The metrics dashboard provides a comprehensive view of visitor analytics through various visualizations and data tables:
Overview Statistics
At the top of the dashboard, you’ll find summary cards showing:
- Total Visits: Overall number of times the content has been accessed
- Unique Visitors: Estimated count of distinct visitors (based on IP addresses)
- Geographic Reach: Number of different countries visitors came from
- Device Types: Breakdown of desktop, mobile, and tablet access percentages
Time Period Filtering
Use the dropdown at the top of the dashboard to filter metrics by time period:
- Last 5 minutes, 15 minutes, 30 minutes
- Last 1 hour, 6 hours, 12 hours
- Last 24 hours (default), 2 days, 7 days
- Last 30 days, 90 days, 6 months, 12 months
- All time
Visualizations
The dashboard includes several interactive charts:
Geographic Distribution
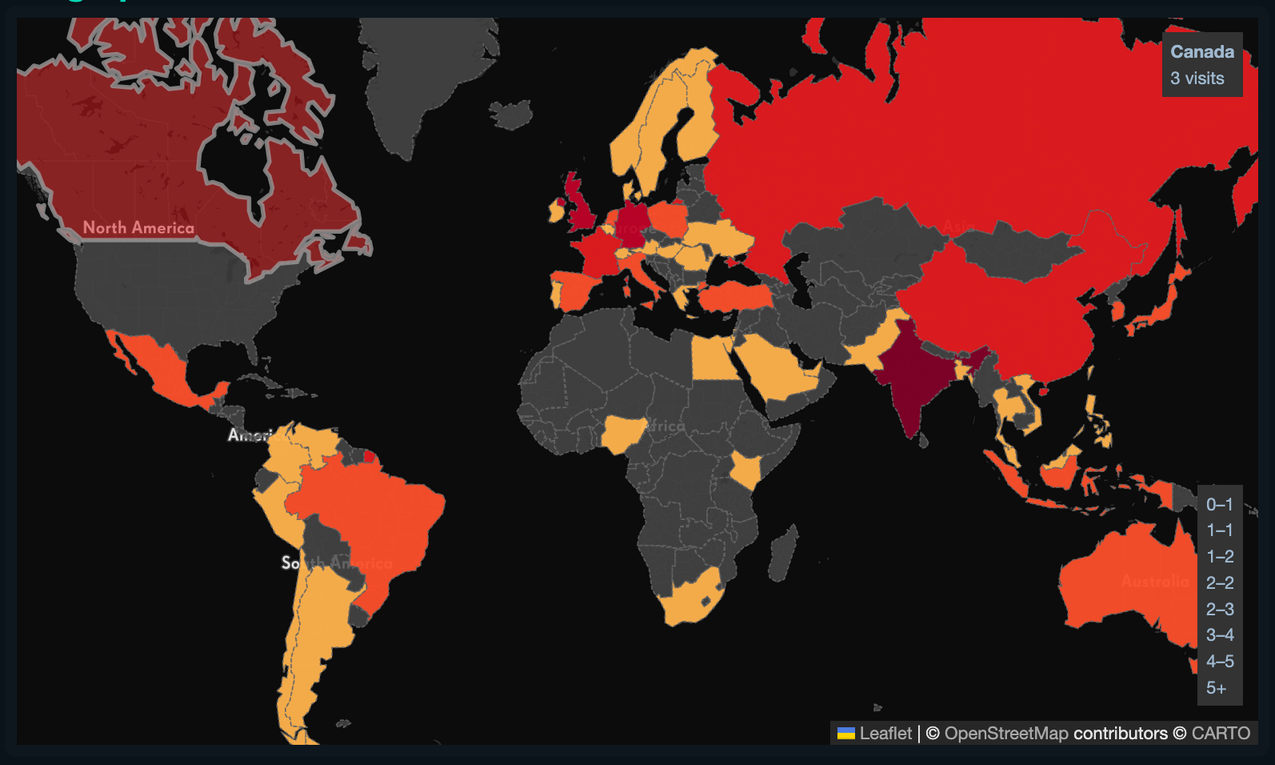
- Interactive World Map: Visual representation of visitor locations with color-coded countries based on visit counts
- Hover over countries to see detailed visit counts
- Click on countries on mobile devices to view information
- Darker colors indicate higher visit counts
- Top Countries Chart: Pie chart showing the top 12 countries by visit count
- Top Cities Chart: Pie chart displaying the top 12 cities with the most visits
Device Analytics
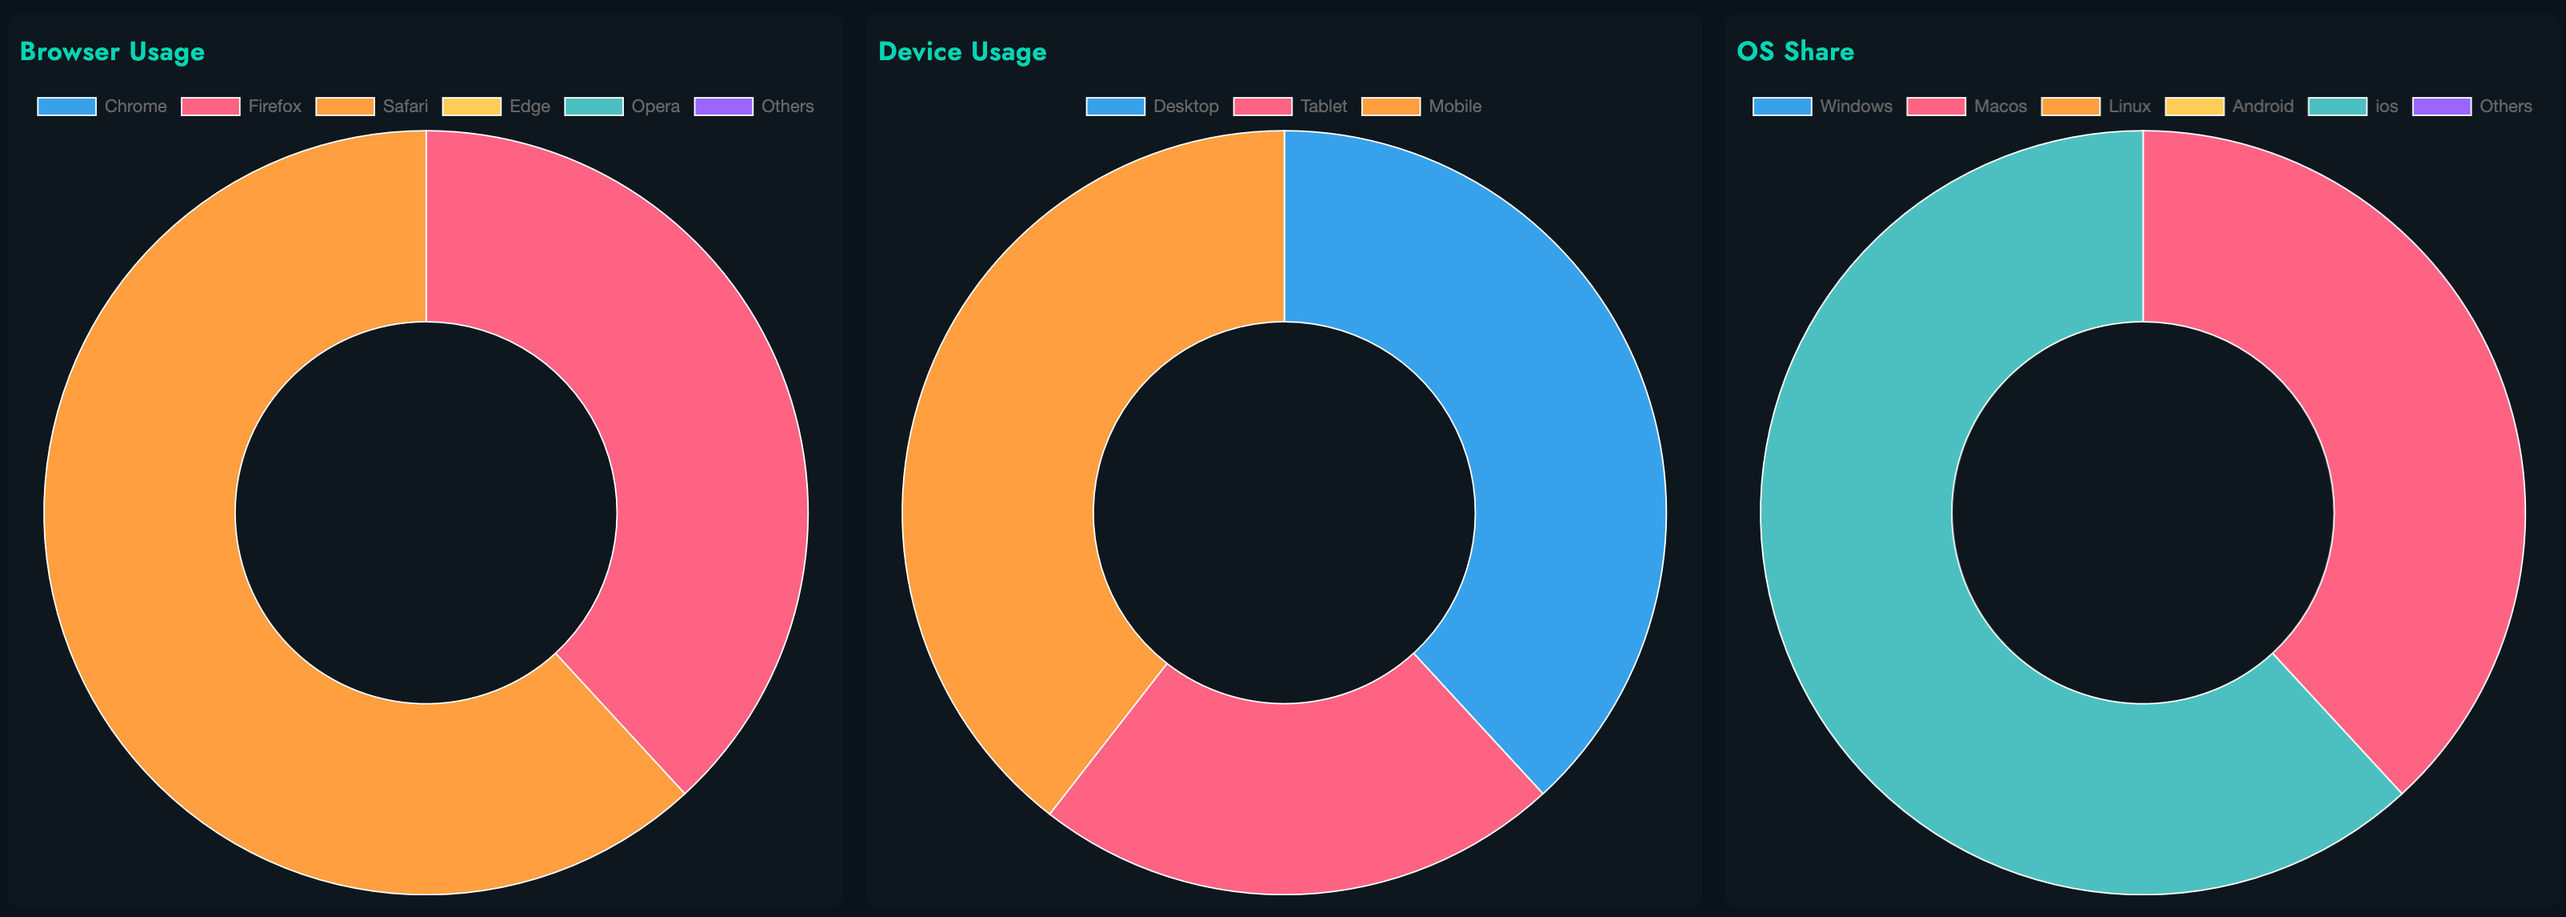
- Browser Distribution: Doughnut chart showing browser usage (Chrome, Firefox, Safari, Edge, Opera, Others)
- Device Type Breakdown: Doughnut chart visualizing Desktop vs. Mobile vs. Tablet usage
- Operating System Share: Doughnut chart displaying distribution of operating systems (Windows, macOS, Linux, Android, iOS, Others)
Temporal Patterns
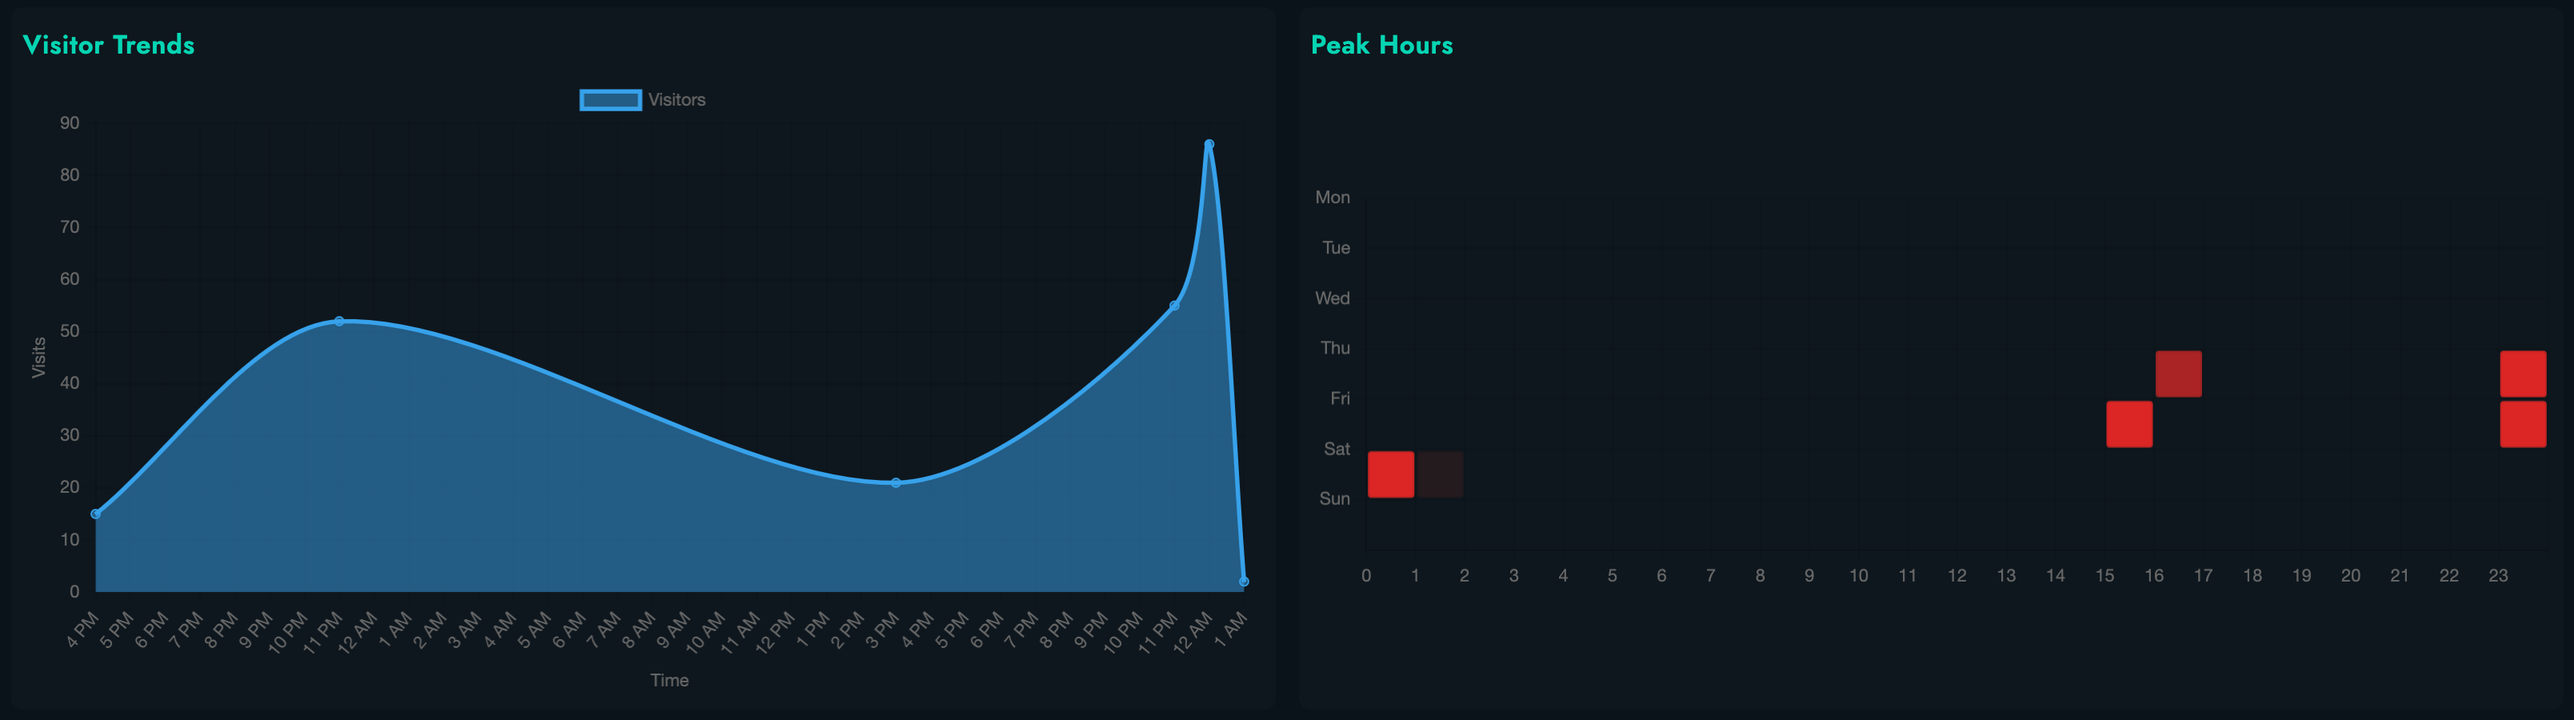
- Visit Timeline: Line graph showing visits over time, with automatic granularity adjustment based on selected time period
- Minutes for periods less than 6 hours
- Hours for 6 hours to 2 days
- Days for 2 days to 3 months
- Weeks for 3 to 6 months
- Months for periods longer than 6 months
- Peak Hours Heatmap: Interactive matrix visualization showing the most active access times by day of week and hour of day
- Darker cells indicate higher activity
- Hover to see exact visit counts for each time slot
Detailed Data Table
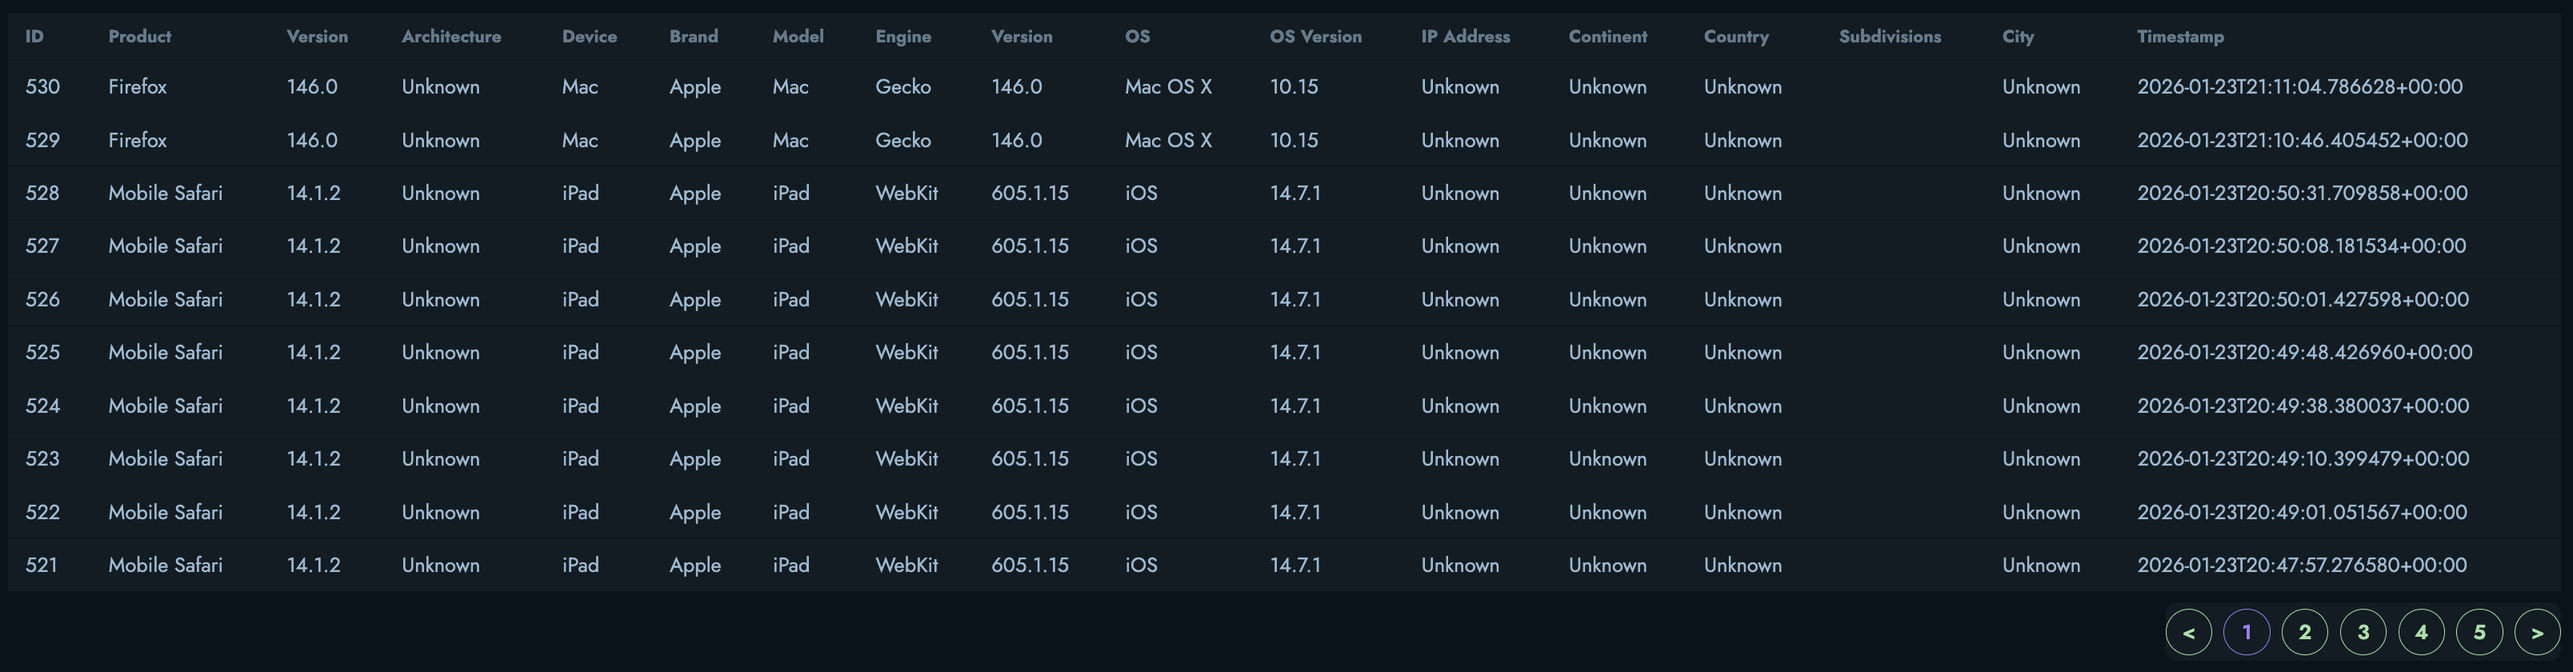
Below the visualizations, a detailed table lists individual metric entries with:
- Unique metric ID
- Browser product name and version
- CPU architecture
- Device type, brand, and model
- Rendering engine and version
- Operating system and version
- IP address
- Geographic location (continent, country, subdivisions, city)
- Timestamp of access
The table supports:
- Pagination: Navigate through large datasets with 10 entries per page
- Responsive Display: Horizontal scrolling on smaller screens to show all columns
Privacy and Permissions
Access Control
Metrics viewing is restricted based on user roles:
- Content Owners: Can view metrics for their own content
- Administrators: Can view metrics for all content
- Regular Users: Cannot view metrics for others’ content
This ensures that sensitive visitor information is only accessible to authorized users.
Data Privacy
The metrics system is designed with privacy in mind:
- IP addresses are stored but only displayed to administrators
- Geographic data is derived from IP addresses using the GeoIP2 database
- No personally identifiable information beyond IP addresses is collected
- All data collection is passive and transparent to visitors
Filtering and Analyzing Metrics
Time-Based Filtering
To analyze metrics for specific time periods:
- Use the time period selector at the top of the dashboard
- Choose from presets ranging from 5 minutes to all time
- The dashboard will automatically update all visualizations and statistics
The filtering is client-side, providing instant updates without requiring new data fetches.
Use Cases
Content Optimization
Use metrics to understand:
- Best Performing Content: Which posts or snippets get the most engagement
- Audience Geography: Where your audience is located
- Device Preferences: How users access your content
- Peak Times: When your content is most accessed
Technical Decisions
Make informed decisions about:
- Browser Compatibility: Prioritize support for browsers your audience uses
- Responsive Design: Understand the balance between mobile and desktop users
- Performance Optimization: Focus on devices and connections your users have
Marketing and Outreach
Leverage insights for:
- Geographic Targeting: Focus marketing efforts on regions with high engagement
- Content Timing: Publish content when your audience is most active
- Platform Strategy: Prioritize platforms used by your audience
Security and Monitoring
Identify potential issues:
- Unusual Access Patterns: Detect potential automated or malicious access
- Geographic Anomalies: Notice unexpected traffic from certain regions
- Traffic Spikes: Monitor sudden increases in access
Best Practices
For effective use of metrics:
- Regular Review: Check metrics weekly to understand trends
- Comparative Analysis: Compare metrics across different content pieces
- Action on Insights: Use data to inform content and technical decisions
- Privacy Respect: Be mindful of visitor privacy when using metrics data
- Data Retention: Regularly export and archive historical metrics
- Pattern Recognition: Look for patterns over time rather than focusing on individual visits
Limitations and Considerations
Be aware of these limitations:
- Ad Blockers: Some visitors may block tracking
- VPN Usage: Geographic data may be inaccurate for VPN users
- Browser Privacy: Privacy-focused browsers may limit user agent information
- Unique Visitors: Estimation based on IP addresses is not perfectly accurate
- Bot Traffic: Some automated traffic may be included in metrics
Future Enhancements
Planned improvements to the metrics system include:
- Real-time Analytics: Live updating of metrics as visitors access content
- Automated Reports: Scheduled email reports with key insights
- Advanced Filtering: More sophisticated query and filter options
- Custom Dashboards: Ability to create personalized metric views
- API Access: Programmatic access to metrics data
- Integration: Connect metrics with other analytics platforms